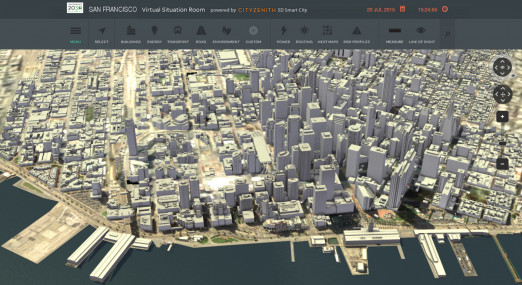
5D Smart City by Cityzenith, Chicago
With the mission of making ‘data in cities useable and useful to city governments, businesses and citizens’, 5D Smart City maps multiple complex data sources into an interactive 3D interface. The aim is that the system is so intuitive that everyone from the Mayor to most citizens can find it useful. It has been five years in creation, from an idea by Remi Arnaud, former lead developer of Google Earth. It is now rolling out worldwide with major cities adopting it.
According to the World Health Organization, in 2014 54% of the world’s population lived in cities, and on current trends will grow a further 1.84% between now and 2020, so that by 2050, fully two-thirds of people will live in cities. Aside from managing the traditional issues emerging from an increased population, cities will be facing the impact of climate change on resources, so creative data management is one key to the health of our cities – the other is getting citizens actively engaged and taking hold of these issues.
While there are many factors at work in our everyday experience of the city - from the commute to the quality of schools for our kids, to housing for low-wage public sector workers pushed out of big cities - the important feature is for the public to be able to visualise some of these drivers, to get a sense of complexity and how we can successfully engage with it.
Context
Could you explain some of the traditional methods and systems of urban planning?
Urban Planning is a large market space with specialised tools and skilled staff required to meet the demands of today’s planning challenges, but also future demands for planning into the near- and long-term future. Typically these tools focused around GIS [Graphic Information Systems], with products from companies such as ESRI, Bentley, AutoCAD, and FME (to name a few). None of them are tailored for the Smart Cities and the era of the Internet of Things. There were no tools to deal with the massive amount of data collected — and variety of sources for that data — in the context of the urban environment.

Research
Who did you speak to as you developed Cityzenith? What kinds of professionals or citizen groups did you engage with?
We conducted research among industry experts in three primary groups that supported the product development path:
1) Architecture/Planning (M.Jansen)
2) Technical software engineering (R.Arnaud)
3) City departments (City CTOs, CIOs, Data Analytics Depts.)
Making
What were the main challenges in developing the system?
Design and development of a product that ties together non-spatial and spatial silo data and information into cohesive, multi-dimensional, easy-to-use product platform has its challenges.
These challenges included selecting the visualisation engine, the method of integration, and dealing with the incoming big data solutions from sensors – streetlight data, smart energy meters, traffic cameras…
The Visual
What were the most important aspects in developing the interface and its interactivity?
One of Cityzenith’s key goals was to facilitate smooth operations within and between city departments through an immersive and intuitive interface – the city model performing as users’ primary interface to the data and information provided.
Problems we needed to solve included: CPU (Central Processing Unit)/GPU (Graphics Processing Unit) performance, fluid integration implementation, model precision criteria, and user experience of information (i.e. how we presented information visually).
Futures
How have cities used the system so far? What do you think will be the tangible impact on the development of cities?
Core customer use-cases range from energy performance monitoring, to infrastructure planning support and even intelligence support for the security services. A typical user can be anyone from a city planner coordinating with developers and architects around a project to the DoE official investigating traffic and pollution issues raised by citizens.
The San Francisco Department of the Environment, in collaboration with the 2030 District program and the SF Department of Energy, are currently using 5D Smart City for building energy efficiency and Greenhouse Gas emissions benchmarking. This is aimed at helping property owners or managers within the city report on and comply with efficiency and emissions targets set by City and State governments. In Chicago and Amsterdam, the focus is on mapping underground infrastructure for planning, development, and security purposes.
5D Smart City acts as a force-multiplier in city and enterprise operations in the built environment — using it, one person could potentially handle the day-to-day operations of 3-5 people (depending on the task at hand). We have designed the platform as a new way for users to create meaning and value out of raw information, eventually building their own apps and services atop it as further use-cases emerge.